
Preventive maintenance saves money on assets where failure causes high-cost disruption. The U.S. Department of Energy documents that well-run PM programs reduce total maintenance costs and extend equipment life significantly. Pair that with the fact that reactive repairs cost 3–5 times more per incident than planned work, and the financial case becomes hard to argue against. Mikes Garage Doors Loveland Colorado sees this play out directly in Northern Colorado: commercial clients who schedule regular garage door tune-ups avoid the emergency call fees, rush parts, and lost-access downtime that hit reactive customers hard.
The three cost channels PM cuts most reliably:
- Emergency labor premiums — overtime rates run 1.5–2× standard, triggered every time a failure lands outside business hours
- Expedited parts and shipping — rush orders add 25–100% or more to parts cost versus kitted, pre-ordered inventory
- Cascading failures — a single neglected component (a worn spring, a failing bearing) forces multi-component replacement when it finally lets go
Start with a risk-prioritized PM program and track Planned Maintenance Percentage (PMP) as your first KPI. That single ratio tells finance more about program health than any narrative ever will.
Table of Contents
- What preventive maintenance is and the main PM types facility teams use
- How preventive maintenance actually reduces costs
- How to quantify PM savings and build an ROI calculation
- When preventive maintenance is not cost-effective
- How CMMS and predictive tools make PM cheaper and easier to scale
- Concrete strategies facility managers use to cut maintenance costs now
- A real-world example: garage door PM at a commercial facility
- How to build a PM business case for finance
- Key Takeaways
- The case for PM that most articles miss
- Garage door PM services in Northern Colorado
- Useful sources
- FAQ
What preventive maintenance is and the main PM types facility teams use
Preventive maintenance is scheduled servicing performed before a failure occurs. You inspect, lubricate, adjust, and replace wear components on a defined schedule, keeping assets running at design performance rather than chasing breakdowns. The goal is predictability: known costs, known labor hours, and no surprises on the operations budget.
Four PM types cover most facility programs:
- Time-based PM — tasks triggered by calendar intervals (monthly, quarterly, annually), regardless of actual usage. Simple to schedule, easy to track, but can lead to over-maintenance on lightly used assets.
- Usage-based PM — tasks triggered by run-hours, cycles, or mileage. More precise than time-based for high-utilization equipment.
- Condition-based maintenance (CBM) — tasks triggered by sensor readings or inspection findings (vibration, temperature, wear measurement). Reduces unnecessary PM on healthy assets.
- Predictive maintenance — uses IoT sensors and data analytics to forecast failure before it happens. Highest upfront cost, highest long-term savings on critical assets.
| PM Type | Typical Trigger | Best Use Case | Cost/Complexity |
|---|---|---|---|
| Time-based | Calendar interval | HVAC filters, door hardware, lighting | Low cost, low complexity |
| Usage-based | Run-hours or cycles | Compressors, motors, fleet vehicles | Low-medium cost, moderate tracking |
| Condition-based | Sensor or inspection threshold | Pumps, bearings, electrical panels | Medium cost, requires monitoring |
| Predictive | IoT/analytics forecast | Critical production or safety assets | Higher upfront, lower long-run cost |
Standards like ASHRAE 180 (HVAC inspection and maintenance) and BOMA 360 (building operations excellence) set baseline PM expectations many commercial leases and insurance carriers now reference. If your program aligns with those frameworks, you have a defensible benchmark when finance or a tenant asks why you're spending on scheduled maintenance.
How preventive maintenance actually reduces costs
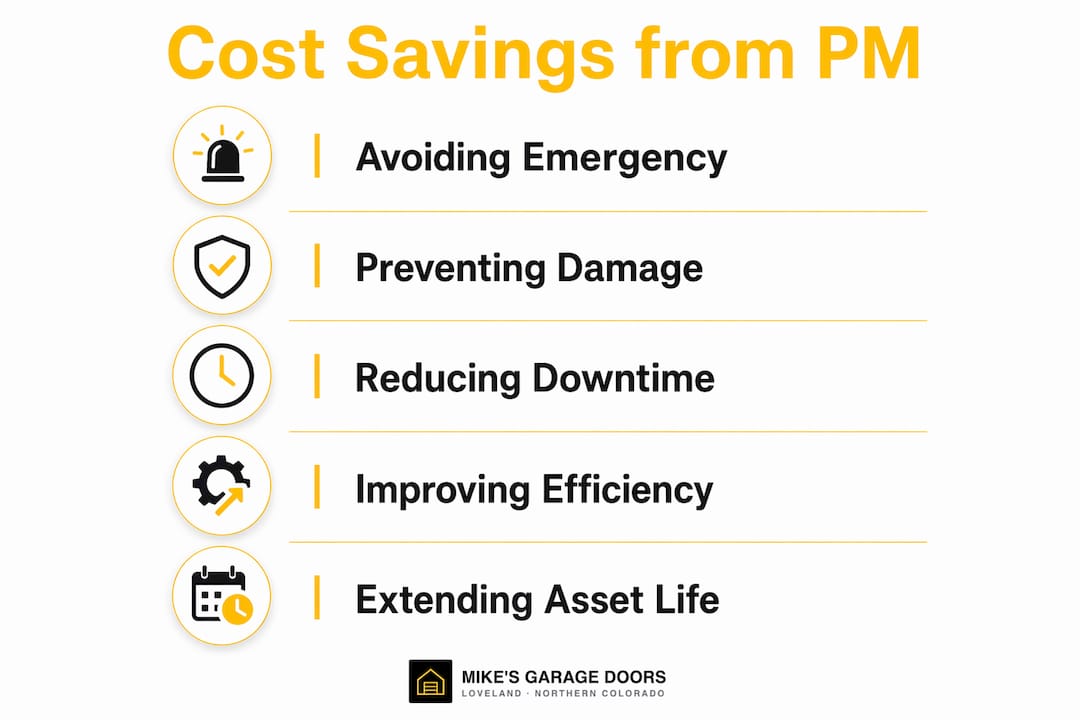
The savings don't come from one place. They stack across six distinct cost drivers, and understanding each one helps you make the case to finance with specifics rather than generalities.
1. Avoiding emergency labor premiums
Unplanned failures almost always happen at the worst time. Overtime labor runs 1.5–2× standard rates, and weekend or after-hours call-outs compound that. A planned PM task that takes two hours at $65/hour costs $130. The same repair called in on a Saturday night at 1.5× overtime costs $195 in labor alone, before parts or diagnostics.
2. Preventing cascading damage
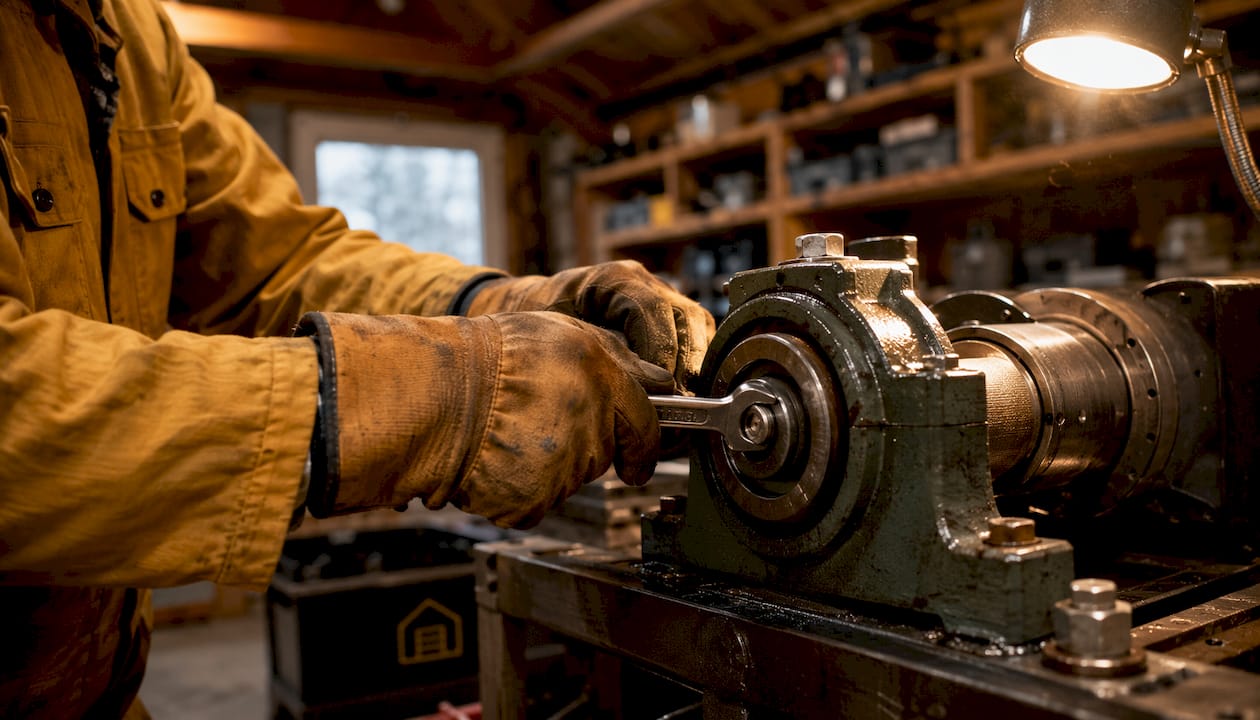
This is the hidden multiplier most reactive budgets underestimate. A $180 bearing left uninspected fails and takes out a shaft, a seal, and a motor winding with it. What started as a $180 part becomes a $2,400 repair plus the downtime cost while you wait for components. PM catches the bearing at the inspection stage, before the cascade starts.
3. Reducing unplanned downtime
Downtime costs vary widely by facility type, but the formula is consistent: lost revenue or productivity per hour, plus labor standing idle, plus any tenant abatement or contract penalties. Predictive and preventive maintenance together can cut downtime by 30–50% and reduce maintenance costs by 10–15% in some studies. For a facility where one hour of downtime costs $5,000, avoiding even four unplanned outages per year is a $20,000 line item.
4. Improving energy efficiency
HVAC systems alone account for 30–50% of total building energy consumption, depending on facility type and climate. Dirty coils, clogged filters, and misaligned dampers force systems to work harder to hit the same setpoints. IFMA frames PM as a risk-adjusted investment precisely because energy savings show up on the utility bill within the same budget cycle as the PM spend.

5. Extending asset life and deferring CapEx
The DOE's documented 20–40% life extension from PM programs means a $120,000 rooftop unit that would otherwise need replacement at year 12 now runs to year 15 or 16. That's three to four years of CapEx deferral, which finance can model directly against the PM program cost.
6. Reducing insurance exposure and liability
Documented PM programs can reduce property insurance premiums by 5–15% in some programs. More importantly, a documented maintenance record is your first line of defense in a liability claim. An uninspected asset that injures someone is a very different legal exposure than one with a current service log.
Stat to know: Reactive repairs cost 3–5× more per incident than the same repair performed on a planned basis, driven by overtime, rush parts, and collateral damage combined.
How to quantify PM savings and build an ROI calculation
Finance teams don't respond to "PM is good practice." They respond to numbers tied to cost centers. Here's the framework to build that case.
KPIs to track
- Planned Maintenance Percentage (PMP) — planned work orders ÷ total work orders × 100. Target: 70–80%.
- Mean Time Between Failures (MTBF) — average operating time between unplanned failures. Rising MTBF means PM is working.
- Mean Time to Repair (MTTR) — average time to restore a failed asset. Falling MTTR means faster recovery when failures do occur.
- Downtime cost per hour — (lost revenue + idle labor + penalties) ÷ downtime hours.
- Cost per reactive job vs. cost per planned job — the ratio that proves the emergency premium to finance.
- Parts cost delta — kitted/pre-ordered cost vs. expedited cost per job.
- CapEx deferral value — replacement cost × years deferred, discounted to present value.
Worked ROI example: 100,000 sq ft commercial building
| Input | Baseline (Reactive) | With PM Program | Annual Delta |
|---|---|---|---|
| Unplanned failures/year | 24 | — | 16 avoided |
| Emergency labor premium | 1.5–2× | — | Saved on 16 jobs |
| Hours downtime avoided/yr | — | 40 hrs | — |
| CapEx deferral (2 assets) | — | 3 yrs deferred | — |
| Payback period | < 4 months |
ROI benchmark: Industry analyses report PM programs delivering a strong return on investment over a multi-year period across combined savings categories.
Data collection checklist for finance
- Pull the last 12 months of work orders and tag each as planned or reactive.
- Calculate your current PMP and compare to the 70–80% industry target.
- Log actual downtime hours and apply your facility's cost-per-hour figure.
- Pull parts invoices and flag any expedited shipping charges.
- Get replacement cost estimates for your top 10 assets and note their current age vs. expected life.
- Request your insurance carrier's documentation discount schedule.
Maintenance metrics guidance from industry advisors consistently shows that MTBF and planned/reactive ratios are more persuasive to finance than high-level claims about "best practices."
When preventive maintenance is not cost-effective
PM is not the right answer for every asset. Over-maintaining low-value equipment wastes budget that should go toward critical systems. Use this framework to decide.
Asset criticality tiers:
- A assets (critical): Failure causes safety risk, production stoppage, or tenant/contract penalties. Full PM program, condition monitoring where feasible.
- B assets (important): Failure causes significant inconvenience or moderate cost but no safety risk. Scheduled PM with defined intervals.
- C assets (non-critical): Failure causes minor inconvenience, easy to replace, no collateral damage. Run-to-failure is often the right call.
Decision rules:
- If the annual PM cost exceeds 40–50% of the asset's replacement cost, run-to-failure and replace on schedule.
- If failure causes no collateral damage and replacement takes less than 24 hours, PM is rarely worth the overhead.
- If a C-class asset fails frequently, reclassify it as B and add PM, or replace it with a more reliable model.
The NIST Advanced Maintenance report notes that preventive maintenance is estimated to be applied unnecessarily up to 50% of the time in some manufacturing environments. That's budget walking out the door on assets that didn't need it.
Pro Tip: Apply the Pareto principle here. Identify the 20–30% of assets responsible for 70–80% of your emergency spend. Build your PM program around those first. You'll capture the largest savings with the smallest initial investment in scheduling and parts inventory.
For garage doors specifically, a high-cycle commercial door on a loading dock is an A asset. A rarely used side-entry door in a low-traffic area is a C asset. Technician availability and scheduling decisions should reflect that difference.
How CMMS and predictive tools make PM cheaper and easier to scale
A spreadsheet-based PM program works at 20 assets. At 200, it breaks down. Computerized Maintenance Management Systems (CMMS) automate the scheduling, parts tracking, and reporting that make a PM program financially measurable and scalable.
Core CMMS capabilities that drive cost savings:
- Automated scheduling — triggers work orders by calendar, meter reading, or sensor threshold, eliminating missed PMs
- Parts kitting — pre-stages the right parts for each job, cutting per-job parts cost and eliminating emergency orders
- Mobile work execution — technicians complete and sign off work orders in the field, creating a real-time audit trail
- Inventory optimization — tracks parts consumption to right-size stocking levels and reduce carrying cost
- MTBF/MTTR and PMP dashboards — generates the exact metrics finance wants without manual data pulls
- Vendor SLA tracking — flags contractor performance against agreed response times and quality standards
MaintainX and UpKeep are two CMMS platforms maintenance teams frequently evaluate. Both offer mobile-first work order management and reporting dashboards. When comparing them, the dimensions that matter most for cost savings are: how the platform handles parts kitting and inventory, whether it ingests condition-monitoring data for CBM triggers, how quickly it generates PMP and MTBF reports, and what the implementation timeline looks like for your team size. A platform that takes six months to implement delays your savings by six months.
Predictive analytics adds an incremental layer on top of standard PM. McKinsey and industry studies report that combining predictive and preventive approaches cuts downtime by 30–50% and reduces maintenance costs by an additional 10–15% beyond standard PM alone. That incremental gain is most defensible on A-class assets where sensor installation cost is small relative to failure consequence.
Feature checklist for CMMS evaluation: scheduling flexibility, condition-data ingestion, vendor SLA tracking, parts kitting, mobile sign-off, automated PMP/MTBF analytics, and integration with your existing ERP or accounting system.
For HVAC systems, the same CMMS logic applies: automated filter-change reminders and coil-cleaning schedules prevent the efficiency degradation that drives up utility costs quarter over quarter.
Concrete strategies facility managers use to cut maintenance costs now
You don't need a full CMMS rollout to start saving. These tactics work with the tools you already have.
Asset stratification and PM frequency:
- Sort your asset list into A/B/C tiers using failure history and manufacturer guidance.
- Set initial PM intervals from the manufacturer's recommended service schedule, then adjust based on your actual failure data after 90 days.
- For garage door systems, manufacturer guidance typically calls for lubrication and hardware checks every 6 months and spring/cable inspections annually for commercial applications.
Parts kitting and vendor sourcing:
- Pre-kit parts for your top 20 most-frequent PM tasks. A kitted job eliminates the parts-hunt delay and the risk of ordering the wrong component under pressure.
- Negotiate blanket purchase orders with one or two primary suppliers for your highest-volume parts. Volume commitments reduce per-unit cost and eliminate expedited shipping on routine items.
- Keep a small buffer stock of high-failure-rate consumables (belts, filters, springs, sensors) so a single failure doesn't trigger a rush order.
Scheduling tactics:
- Batch similar PMs in the same zone or floor on the same day to cut technician travel time between jobs.
- Align PMs with low-occupancy windows (early morning, weekends for office buildings) to avoid tenant disruption and abatement claims.
- Use contracted labor for specialized tasks (spring replacement, electrical, HVAC refrigerant work) and in-house staff for routine inspections and lubrication, where the cost-per-task difference is largest.
Pro Tip: Build a simple PM quality check into every work order: the technician records one "found condition" note (e.g., "spring tension within spec" or "noted minor cable fraying, flagged for next visit"). That single data point, collected consistently, becomes your MTBF baseline within one year.
Pro Tip: For preventive door maintenance, a six-point inspection checklist (springs, cables, rollers, tracks, opener force, and sensor alignment) takes under 20 minutes per door and catches 80% of the failure modes that generate emergency calls.
A real-world example: garage door PM at a commercial facility
Here's how a structured PM program plays out for commercial garage door systems, the kind Mikes Garage Doors Loveland Colorado services across Northern Colorado.
The scenario: A distribution facility with eight commercial overhead doors running two shifts daily. Before implementing a PM program, the facility averaged three emergency service calls per month across the door fleet, with an average emergency repair cost of $420 per call (including after-hours labor and expedited parts). Doors were also causing loading dock delays averaging 45 minutes per incident.
PM activities implemented (semi-annual cadence):
- Full spring and cable inspection with tension measurement
- Lubrication of rollers, hinges, tracks, and torsion spring shaft
- Opener force and travel-limit adjustment
- Photo-eye sensor alignment and obstruction test
- Hardware tightening (bolts, brackets, track fasteners)
- Pre-kitted parts staged for each door (rollers, bottom seal, safety cables)
Results after 12 months:
- Emergency calls dropped from 36/year to 6/year (30 avoided incidents)
- Average planned repair cost: $185 per visit vs. $420 reactive
- Downtime per incident fell from 45 minutes to under 15 minutes (planned work, parts on hand)
- Annual savings on emergency labor and parts: approximately $7,050
- Loading dock productivity recovered: roughly 22 hours of delay time eliminated
Those outcomes map directly to the KPIs finance wants: PMP climbed from roughly 25% to over 80%, MTBF on the door fleet more than doubled, and emergency spend dropped by over $7,000 annually against a PM contract cost well below that figure.
For facilities that want a structured starting point, the diagnostic inspection process Mikes Garage Doors Loveland Colorado uses covers all the failure modes that generate emergency calls.
How to build a PM business case for finance
Finance needs a story told in numbers, not maintenance jargon. Here's the exact sequence.
Step-by-step checklist
- Collect baseline data — pull 12 months of work orders, tag planned vs. reactive, and calculate current PMP.
- Calculate downtime cost per hour — use (lost revenue + idle labor + penalties) ÷ total downtime hours.
- Model three scenarios — status quo (reactive), basic PM (time-based), and optimized PM (condition-based on A assets). Show projected annual cost for each.
- Pilot one asset class — pick your highest-emergency-spend asset category, implement PM for 90 days, and track actual results vs. model.
- Measure and report at 90 and 180 days — compare PMP, MTBF, emergency spend, and energy consumption to baseline.
- Scale to full program — use pilot results as proof of concept for the full asset portfolio.
Sample slide bullets for finance presentation
- Current reactive spend: $[X]/year across [N] unplanned incidents — 3–5× the cost of the same repairs on a planned basis
- Projected PM program cost: $[Y]/year — payback period under [Z] months based on avoided emergency spend alone
- CapEx deferral: PM extends asset life 20–40%, pushing $[A] in planned replacements out by 3–5 years
- Insurance premium reduction potential: 5–15% with documented PM program — estimated $[B]/year
- Target KPIs: PMP ≥ 70%, MTBF improvement ≥ 25% within 12 months
Monthly KPI dashboard outline
- PMP — planned work orders ÷ total work orders (target: ≥ 70%)
- MTBF by asset class — track month-over-month trend
- Emergency spend vs. planned spend — dollar amounts and ratio
- Energy consumption index — kWh per sq ft or per production unit
- Open PM compliance rate — PMs completed on schedule ÷ PMs scheduled
For commercial garage door scheduling, these same KPIs apply directly and give property managers a clean monthly report for building owners or asset managers.
Key Takeaways
Preventive maintenance saves money by converting unpredictable emergency costs into planned, lower-cost interventions, with documented savings of 12–18% on total maintenance spend, 20–40% equipment life extension, and reactive repairs costing 3–5× more per incident than planned work.
| Point | Details |
|---|---|
| PM reduces total maintenance costs | DOE data shows 12–18% cost reduction and 20–40% equipment life extension from structured PM programs. |
| Reactive repairs cost far more | Emergency repairs run 3–5× the cost of planned work due to overtime, rush parts, and cascading damage. |
| Track PMP, MTBF, and MTTR | These three KPIs are the most persuasive metrics for finance and signal program maturity at a glance. |
| Not every asset needs PM | Run-to-failure is the right call for C-class assets where failure causes no collateral damage and replacement is cheap. |
| Mikes garage doors Loveland colorado | Provides structured commercial garage door PM in Northern Colorado, with same-day service and upfront pricing. |
The case for PM that most articles miss
Most PM articles stop at "it saves money." That's true but incomplete. The deeper argument is about control.
Reactive maintenance doesn't just cost more per incident. It hands control of your budget, your schedule, and your tenant relationships to random failure events. A failed spring at 6 AM on a Monday doesn't care about your CapEx cycle or your lease renewal negotiation. PM gives you back the initiative.
The part facility managers underestimate most is the compounding effect. One avoided cascade failure funds six months of PM on that asset class. One deferred equipment replacement funds a CMMS subscription for two years. The savings don't just add up linearly. They create slack in the budget that lets you invest in the next tier of improvement.
There's also a staffing argument nobody talks about. Maintenance teams running 70–80% planned work are less stressed, make fewer errors, and retain better than teams in constant firefighting mode. Turnover in skilled trades is expensive. A PM program that stabilizes the workload is also a retention tool, even if it never shows up on a maintenance ROI spreadsheet.
The honest caveat: PM is not a universal answer. Over-maintaining C assets is a real budget drain, and the NIST data showing PM applied unnecessarily up to 50% of the time in some environments is a genuine warning. The discipline is in the triage, not just the scheduling.
Garage door PM services in Northern Colorado
If you manage a commercial property or multi-unit facility in Northern Colorado and your garage doors are still on a reactive-only schedule, the math above applies directly to your situation.

Mikes garage doors Loveland colorado offers structured preventive maintenance for commercial and residential garage door systems across Loveland and the surrounding area. The service is family-owned, with upfront phone estimates, no surprise fees, and 90% of repairs completed the same day. Veterans receive a 10% discount, and all work is backed by warranties that give property managers something concrete to show building owners.
The next step is straightforward: schedule a garage door inspection or request a custom PM contract for your facility. One call gets you a clear scope, a fixed price, and a service cadence you can drop straight into your maintenance calendar and your finance presentation.
Useful sources
- U.S. DOE O&M Best Practices Guide — primary source for PM cost-reduction benchmarks (12–18% savings, 20–40% life extension) and energy efficiency guidance for federal and commercial facilities.
- NIST AMS 100-18: Costs and Benefits of Advanced Maintenance — peer-reviewed analysis of predictive and preventive maintenance ROI across manufacturing; includes firm-level case studies and cost-per-horsepower comparisons.
- IFMA: The ROI of Preventive Maintenance — facility management industry perspective on PM as a risk-adjusted investment; covers energy, asset life, and operational continuity ROI dimensions.
- Left Coast Facilities Consulting: PM Cost Savings and ROI — summarizes DOE and McKinsey benchmarks for downtime reduction (30–50%) and maintenance cost reduction with combined predictive/preventive programs.
- Reliability Simplified: The Real Cost of Reactive Maintenance — detailed breakdown of the 3–5× reactive cost multiplier with component-level analysis of overtime, expedited parts, and collateral damage.
- Re-Leased: Preventive vs. Reactive Maintenance ROI — commercial property focus; covers 3–4× PM ROI benchmark and 5–15% insurance premium reduction data.
- Primus Maintain: Reactive vs. Proactive Maintenance Data — operational targets for 70–80% planned work ratio and implementation best practices for reaching that benchmark.
FAQ
How does preventive maintenance reduce costs?
PM reduces costs by replacing expensive emergency repairs with lower-cost planned work, avoiding cascading failures, extending asset life, and improving energy efficiency. Reactive repairs cost 3–5× more per incident than the same repair performed on a scheduled basis.
Does preventive maintenance actually save money?
Yes, for most critical assets. The DOE documents 12–18% reductions in total maintenance costs, 20–40% equipment life extension, and industry analyses show PM programs delivering roughly 3–4× ROI over a multi-year period across combined savings categories.
Why does preventive maintenance matter for facility budgets?
It converts unpredictable emergency spend into planned, controllable costs, which makes budgeting more accurate and gives finance teams the KPIs (PMP, MTBF, MTTR) they need to justify maintenance investment.
What is the main advantage of preventive maintenance?
The single biggest advantage is avoiding the 3–5× cost multiplier of reactive repairs, particularly the overtime labor premiums, expedited parts costs, and collateral damage that stack up every time an unplanned failure occurs.
When should you skip preventive maintenance?
Skip PM on C-class assets where failure causes no collateral damage, replacement is inexpensive, and the annual PM cost approaches or exceeds 40–50% of the asset's replacement value. Run-to-failure is the more cost-effective strategy for those items.